Metric Displays
OVMS V3 is based on metrics. Metrics can be single numerical or textual values or complex values
like sets and arrays. The web framework keeps all metrics in a global object, which can be read
simply by e.g. metrics["v.b.soc"].
In addition to the raw metric values, there are 2 main proxy arrays that give access to the
user-configured versions of the raw metric values. The metrics_user array
converts the ‘metrics’ value to user-configured value and the metrics_label array
provides the corresponding label for that metric.
So for example the user could configure distance values to be in miles, and in this case
metrics["v.p.odometer"] would still contain the value in km (the default) but
metrics_user["v.p.odometer"] would give the value converted to miles and
metrics_label["v.p.odometer"] would return “M”.
The user conversion information is contained in another object units. units.metrics
has the user configuration for each metric and units.prefs has the user configuration
for each group of metrics (distance, temperature, consumption, pressure etc). There also some methods
for general conversions allowing user preferences:
The method
units.unitLabelToUser(unitType,name)will return the user defined label for that ‘unitType’, defaulting toname.The method
units.unitValueToUser(unitType,value)will convertvalueto the user defined unit (if set) for the group.
Metrics updates (as well as other updates) are sent to all DOM elements having the
receiver class. To hook into these updates, simply add an event listener for
msg:metrics:. The event msg:units:metrics is called when units.metrics is change
and msg:units:prefs when units.prefs are changed.
Listening to the event is not necessary though if all you need is some metrics
display. This is covered by the metric widget class family as shown here.
Single Values & Charts

The following example covers…
Text (String) displays
Number displays
Progress bars (horizontal light weight bar charts)
Gauges
Charts
Where a number element of class ‘metric’ contains both elements of class ‘value’ and ‘unit’, these will be automatically displayed in the units selected in the user preferences. Having a ‘data-user’ attribute will also cause the ‘value’ element to be displayed in user units (unless ‘data-scale’ attribute is present).
Gauges & charts use the HighCharts library, which is included in the web server. The other widgets are simple standard Bootstrap widgets extended by an automatic metrics value update mechanism.
Highcharts is a highly versatile charting system. For inspiration, have a look at:
We’re using styled mode so some options don’t apply, but everything can be styled by standard CSS.
Install the example as a web page plugin:
metrics.htm (hint: right click, save as)
1<!--
2 Test/Development/Documentation page; install as plugin to test
3-->
4
5<div class="panel panel-primary">
6 <div class="panel-heading">Metrics Displays Test/Demo</div>
7 <div class="panel-body">
8
9 <p>OVMS V3 is based on metrics. Metrics can be single numerical or textual values or complex values
10 like sets and arrays. The web framework keeps all metrics in a global object, which can be read
11 simply by e.g. <code>metrics["v.b.soc"]</code>.</p>
12
13 <p>Metrics updates (as well as other updates) are sent to all DOM elements having the
14 <code>receiver</code> class. To hook into these updates, simply add an event listener for
15 <code>msg:metrics</code>. Listening to the event is not necessary if all you need is some metrics
16 display. This is covered by the <code>metric</code> class family as shown here.</p>
17
18 <p>
19 <button type="button" class="btn btn-default action-gendata">Generate random data</button>
20 <button type="button" class="btn btn-default action-showsrc">Show page source</button>
21 </p>
22
23 <hr/>
24
25 <div class="receiver">
26
27 <h4>Basic usage</h4>
28
29 <p>All elements of class <code>metric</code> in a <code>receiver</code> are checked for the
30 <code>data-metric</code> attribute. If no specific metric class is given, the metric value
31 is simply set as the element text: <span class="metric" data-metric="m.net.provider">?</span>
32 is your current network provider.</p>
33
34 <h4>Text & Number</h4>
35
36 <p><code>number</code> & <code>text</code> displays get the metric value set in their child of
37 class <code>value</code>. They may additionally have labels and units. <code>data-prec</code> can
38 be used on <code>number</code> to set the precision, <code>data-scale</code> to scale the raw
39 values by a factor. They have fixed min widths and float by default, so you can simply put
40 multiple displays into the same container:</p>
41
42 <div class="clearfix">
43 <div class="metric number" data-metric="v.e.throttle" data-prec="0">
44 <span class="label">Throttle:</span>
45 <span class="value">?</span>
46 <span class="unit">%</span>
47 </div>
48 <div class="metric number" data-metric="v.b.12v.voltage.ref" data-prec="1">
49 <span class="value">?</span>
50 <span class="unit">V<sub>ref</sub></span>
51 </div>
52 <div class="metric text" data-metric="m.net.provider">
53 <span class="label">Network:</span>
54 <span class="value">?</span>
55 </div>
56 </div>
57
58 <h4>Derived Values</h4>
59
60 <p>If the <code>metric</code> element has a <code>data-template</code> attribute, its content is
61 interpreted as a Javascript
62 <a target="_blank" href="https://developer.mozilla.org/en-US/docs/Web/JavaScript/Reference/Template_literals">
63 ES6 template string</a>. The interpolation result replaces the text content of either the element's
64 children with class <code>value</code>, or if none are present of the element itself.</p>
65
66 <p>This can be used to display values calculated or combined from multiple metrics, or apply
67 simple custom value formatting and code translations without the need to implement a custom
68 reception handler.</p>
69
70 <p>Example: derive 12V power as voltage × current:</p>
71
72 <div class="clearfix">
73 <div class="metric number" data-metric="v.b.12v.voltage,v.b.12v.current"
74 data-template="${(metrics['v.b.12v.voltage'] * (metrics['v.b.12v.current']||0.1)).toFixed(2)}">
75 <span class="label">12V Power:</span>
76 <span class="value">–</span>
77 <span class="unit">W</span>
78 </div>
79 </div>
80
81 <h4>Progress Bar</h4>
82
83 <p>Bootstrap <code>progress</code> bars can be used as lightweight graphical indicators.
84 Labels and units are available, also <code>data-prec</code> and <code>data-scale</code>.
85 Again, all you need is a bit of markup:</p>
86
87 <div class="clearfix">
88 <div class="metric progress" data-metric="v.e.throttle" data-prec="0">
89 <div class="progress-bar progress-bar-success value-low text-left" role="progressbar"
90 aria-valuenow="0" aria-valuemin="0" aria-valuemax="100" style="width:0%">
91 <div>
92 <span class="label">Throttle:</span>
93 <span class="value">?</span>
94 <span class="unit">%</span>
95 </div>
96 </div>
97 </div>
98 <div class="metric progress" data-metric="v.b.12v.voltage.ref" data-prec="1">
99 <div class="progress-bar progress-bar-info value-low text-left" role="progressbar"
100 aria-valuenow="0" aria-valuemin="5" aria-valuemax="15" style="width:0%">
101 <div>
102 <span class="label">12V ref:</span>
103 <span class="value">?</span>
104 <span class="unit">V</span>
105 </div>
106 </div>
107 </div>
108 </div>
109
110 <h4>Gauges & Charts</h4>
111
112 <p>The OVMS web framework has builtin support for the highly versatile <b>Highcharts library</b>
113 with loads of chart types and options. <code>chart</code> metric examples:</p>
114
115 <div class="row">
116 <div class="col-sm-6">
117 <div class="metric chart" data-metric="v.e.throttle" style="height:220px">
118 <div class="chart-box gaugechart" id="throttle-gauge"/>
119 </div>
120 </div>
121 <div class="col-sm-6">
122 <div class="metric chart" data-metric="v.b.c.voltage,v.b.c.voltage.min" style="height:220px">
123 <div class="chart-box barchart" id="cell-voltages"/>
124 </div>
125 </div>
126 </div>
127
128 <p><button type="button" class="btn btn-default action-gendata">Generate random data</button></p>
129
130 <p>For charts, a little bit of scripting is necessary.
131 The scripts for these charts contain the chart configuration, part of which is the update
132 function you need to define. The update function translates metrics data into chart data.
133 This is trivial for single values like the throttle, the cell voltage chart is an example
134 on basic array processing.</p>
135
136 <p>Also, while charts <em>can</em> be defined with few options, you'll <em>love</em> to explore
137 all the features and fine tuning options provided by Highcharts. For inspiration,
138 have a look at the <a target="_blank" href="https://www.highcharts.com/demo">Highcharts demos</a>
139 and the <a target="_blank" href="https://www.highcharts.com/docs/">Highcharts documentation</a>.
140 We're using <a target="_blank" href="https://www.highcharts.com/docs/chart-design-and-style/style-by-css">
141 styled mode</a>, so some options don't apply, but everything can be styled by standard CSS.</p>
142
143 </div>
144
145 </div>
146</div>
147
148<script>
149(function(){
150
151 /* Get page source before chart rendering: */
152 var pagesrc = $('#main').html();
153
154 /* Init throttle gauge: */
155 $("#throttle-gauge").chart({
156 chart: {
157 type: 'gauge',
158 spacing: [0, 0, 0, 0],
159 margin: [0, 0, 0, 0],
160 animation: { duration: 500, easing: 'easeOutExpo' },
161 },
162 title: { text: "Throttle", verticalAlign: "middle", y: 75 },
163 credits: { enabled: false },
164 tooltip: { enabled: false },
165 plotOptions: {
166 gauge: { dataLabels: { enabled: false }, overshoot: 1 }
167 },
168 pane: [{
169 startAngle: -125, endAngle: 125, size: '100%', center: ['50%', '60%']
170 }],
171 yAxis: [{
172 title: { text: '%' },
173 className: 'throttle',
174 reversed: false,
175 min: 0, max: 100,
176 plotBands: [
177 { from: 0, to: 60, className: 'green-band' },
178 { from: 60, to: 80, className: 'yellow-band' },
179 { from: 80, to: 100, className: 'red-band' },
180 ],
181 minorTickInterval: 'auto', minorTickLength: 5, minorTickPosition: 'inside',
182 tickPixelInterval: 40, tickPosition: 'inside', tickLength: 13,
183 labels: { step: 2, distance: -28, x: 0, y: 5, zIndex: 2 },
184 }],
185 series: [{
186 name: 'Throttle', data: [0],
187 className: 'throttle',
188 animation: { duration: 0 },
189 pivot: { radius: '10' },
190 dial: { radius: '88%', topWidth: 1, baseLength: '20%', baseWidth: 10, rearLength: '20%' },
191 }],
192 /* Update method: */
193 onUpdate: function(update) {
194 // Create gauge data set from metric:
195 var data = [ metrics["v.e.throttle"] ];
196 // Update chart:
197 this.series[0].setData(data);
198 },
199 });
200
201 /* Init cell voltages chart */
202 $("#cell-voltages").chart({
203 chart: {
204 type: 'column',
205 animation: { duration: 500, easing: 'easeOutExpo' },
206 },
207 title: { text: "Cell Voltages" },
208 credits: { enabled: false },
209 tooltip: {
210 enabled: true,
211 shared: true,
212 headerFormat: 'Cell #{point.key}:<br/>',
213 pointFormat: '{series.name}: <b>{point.y}</b><br/>',
214 valueSuffix: " V"
215 },
216 legend: { enabled: true },
217 xAxis: {
218 categories: []
219 },
220 yAxis: [{
221 title: { text: null },
222 labels: { format: "{value:.2f}V" },
223 tickAmount: 4, startOnTick: false, endOnTick: false,
224 floor: 3.3, ceiling: 4.2,
225 minorTickInterval: 'auto',
226 }],
227 series: [{
228 name: 'Current', data: [],
229 className: 'cell-voltage',
230 animation: { duration: 0 },
231 },{
232 name: 'Minimum', data: [],
233 className: 'cell-voltage-min',
234 animation: { duration: 0 },
235 }],
236 /* Update method: */
237 onUpdate: function(update) {
238 // Note: the 'update' parameter contains the actual update set.
239 // You can use this to reduce chart updates to the actual changes.
240 // For this demo, we just use the global metrics object:
241 var
242 m_vlt = metrics["v.b.c.voltage"] || [],
243 m_min = metrics["v.b.c.voltage.min"] || [];
244 // Create categories (cell numbers) & rounded values:
245 var cat = [], val0 = [], val1 = [];
246 for (var i = 0; i < m_vlt.length; i++) {
247 cat.push(i+1);
248 val0.push(Number((m_vlt[i]||0).toFixed(3)));
249 val1.push(Number((m_min[i]||0).toFixed(3)));
250 }
251 // Update chart:
252 this.xAxis[0].setCategories(cat);
253 this.series[0].setData(val0);
254 this.series[1].setData(val1);
255 },
256 });
257
258 /* Test metrics generator: */
259 $('.action-gendata').on('click', function() {
260 var td = {};
261 td["m.net.provider"] = ["hologram","Vodafone","Telekom"][Math.floor(Math.random()*3)];
262 td["v.e.throttle"] = Math.random() * 100;
263 td["v.b.12v.voltage.ref"] = 10 + Math.random() * 4;
264 var m_vlt = [], m_min = [];
265 for (var i = 1; i <= 16; i++) {
266 m_vlt.push(3.6 + Math.random() * 0.5);
267 m_min.push(3.4 + Math.random() * 0.2);
268 }
269 td["v.b.c.voltage"] = m_vlt;
270 td["v.b.c.voltage.min"] = m_min;
271 $('.receiver').trigger('msg:metrics', $.extend(metrics, td));
272 });
273
274 /* Display page source: */
275 $('.action-showsrc').on('click', function() {
276 $('<div/>').dialog({
277 title: 'Source Code',
278 body: '<pre style="font-size:85%; height:calc(100vh - 230px);">'
279 + encode_html(pagesrc) + '</pre>',
280 size: 'lg',
281 });
282 });
283
284})();
285</script>
Vector Tables
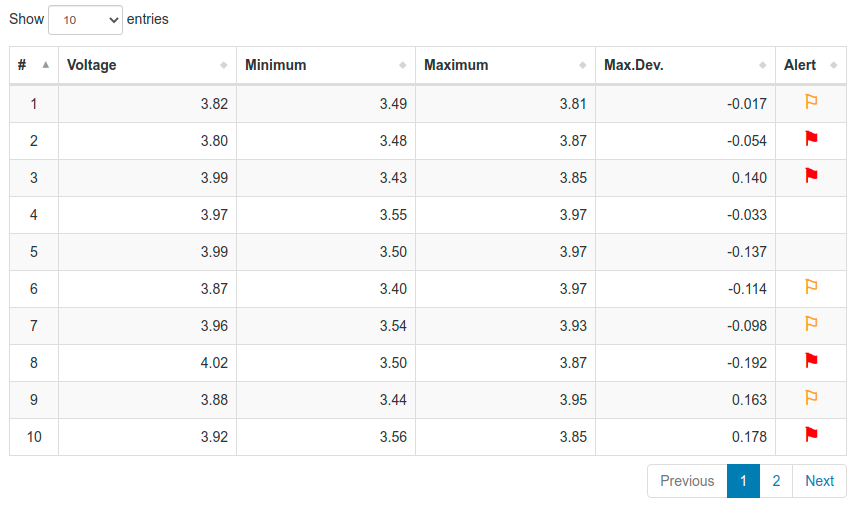
Some metrics, for example the battery cell voltages or the TPMS tyre health data, may contain vectors of arbitrary size. Besides rendering into charts, these can also be displayed by their textual values in form of a table.
The following example shows a live view of the battery cell voltages along with their recorded minimum, maximum, maximum deviation and current warning/alert state. Alert states 0-2 are translated into icons.
The metric table widget uses the DataTables library, which is included in the web server. The DataTables Javascript library offers a wide range of options to create tabular views into datasets.
Install the example as a web page plugin:
metrics-table.htm (hint: right click, save as)
  1<!--
  2  Web UI page plugin: DataTables metrics widget demonstration
  3-->
  4
  5<style>
  6td i {
  7  font-style: normal;
  8  font-size: 140%;
  9  line-height: 90%;
 10  font-weight: bold;
 11}
 12td i.warning { color: orange; }
 13td i.danger { color: red; }
 14</style>
 15
 16
 17<div class="panel panel-primary panel-single receiver" id="my-receiver">
 18  <div class="panel-heading">Metrics Table Widget Example</div>
 19  <div class="panel-body">
 20
 21    <p>The following table shows a live view of the battery cell voltages along with their recorded
 22      minimum, maximum, maximum deviation and current warning/alert state.</p>
 23    <p>Try resizing the window or using a mobile phone to see how the table adapts to the screen
 24      width. The table will also keep the selected sorting over data updates.</p>
 25    <p>Hint: if you don't have live battery cell data, click the generator button to create
 26      some random values. The random data is only generated in your browser, not on the module.</p>
 27
 28    <div class="metric table"
 29      data-metric="v.b.c.voltage,v.b.c.voltage.min,v.b.c.voltage.max,v.b.c.voltage.dev.max,v.b.c.voltage.alert">
 30      <table class="table table-striped table-bordered table-hover" id="v-table" />
 31    </div>
 32
 33    <p>See <a target="_blank" href="https://datatables.net/manual/">DataTables manual</a> for all
 34      options and API methods available.</p>
 35
 36  </div>
 37  <div class="panel-footer">
 38    <p><button type="button" class="btn btn-default action-gendata">Generate random data</button></p>
 39  </div>
 40</div>
 41
 42
 43<script>
 44(function(){
 45
 46  // Utilities:
 47  var alertMap = {
 48    0: '',
 49    1: '<i class="warning">⚐</i>',
 50    2: '<i class="danger">⚑</i>',
 51  };
 52
 53  function fmtCode(value, map) {
 54    return (map[value] !== undefined) ? map[value] : null;
 55  }
 56  function fmtNumber(value, prec) {
 57    return (value !== undefined) ? Number(value).toFixed(prec) : null;
 58  }
 59
 60  // Init table:
 61  $('#v-table').table({
 62    responsive: true,
 63    paging: true,
 64    searching: false,
 65    info: false,
 66    autoWidth: false,
 67    columns: [
 68      { title: "#",         className: "dt-body-center",  width: "6%",  responsivePriority: 1 },
 69      { title: "Voltage",   className: "dt-body-right",   width: "22%", responsivePriority: 3 },
 70      { title: "Minimum",   className: "dt-body-right",   width: "22%", responsivePriority: 4 },
 71      { title: "Maximum",   className: "dt-body-right",   width: "22%", responsivePriority: 5 },
 72      { title: "Max.Dev.",  className: "dt-body-right",   width: "22%", responsivePriority: 2 },
 73      { title: "Alert",     className: "dt-body-center",  width: "6%",  responsivePriority: 1 },
 74    ],
 75    rowId: 0,
 76    onUpdate: function(update) {
 77      // Get vector metrics to display:
 78      var v = [
 79        metrics["v.b.c.voltage"] || [],
 80        metrics["v.b.c.voltage.min"] || [],
 81        metrics["v.b.c.voltage.max"] || [],
 82        metrics["v.b.c.voltage.dev.max"] || [],
 83        metrics["v.b.c.voltage.alert"] || [],
 84      ];
 85      var lcnt = 0;
 86      v.map(el => lcnt = Math.max(lcnt, el.length));
 87      // Transpose vectors to columns:
 88      var l, d = [];
 89      for (l = 0; l < lcnt; l++) {
 90        d.push([
 91          l+1,
 92          fmtNumber(v[0][l], 2),
 93          fmtNumber(v[1][l], 2),
 94          fmtNumber(v[2][l], 2),
 95          fmtNumber(v[3][l], 3),
 96          fmtCode(v[4][l], alertMap),
 97        ]);
 98      }
 99      // Display new data:
100      this.clear().rows.add(d).draw();
101    },
102  });
103
104
105  // Test data generator:
106  $('.action-gendata').on('click', function() {
107    var td = {};
108    var m_vlt = [], m_min = [], m_max = [], m_devmax = [], m_alert = [];
109    for (var i = 1; i <= 16; i++) {
110      m_vlt.push(3.6 + Math.random() * 0.5);
111      m_min.push(3.4 + Math.random() * 0.2);
112      m_max.push(3.8 + Math.random() * 0.2);
113      m_devmax.push(-0.2 + Math.random() * 0.4);
114      m_alert.push(Math.floor(Math.random() * 3));
115    }
116    td["v.b.c.voltage"] = m_vlt;
117    td["v.b.c.voltage.min"] = m_min;
118    td["v.b.c.voltage.max"] = m_max;
119    td["v.b.c.voltage.dev.max"] = m_devmax;
120    td["v.b.c.voltage.alert"] = m_alert;
121    $('.receiver').trigger('msg:metrics', $.extend(metrics, td));
122  });
123
124})();
125</script>